


I collaborated with a talented team of designers and developers to refine Imagine Cities' visual identity and website to bolster their visibility, attract key stakeholders, and increase user engagement.
Tap or hover to zoom


The Homepage—Facilitating Easier and Faster User Exploration


Our Digital Tools Page—Visualizing the Mission


About Us Page—Consolidating History and Other Important Info


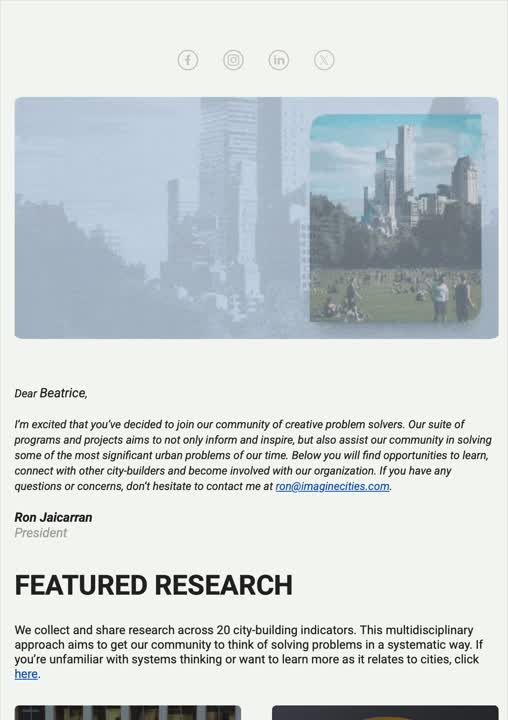
A Semi-New Newsletter—Updating Email Campaigns to Reflect Brand Refresh
We worked collaboratively to ensure that the website is responsive across all screen sizes, and by extension, to any individuals in need of Imagine Cities’ online resources.
Aggregates useful articles tagged with relevant research categories under one platform.

Aggregates useful articles tagged with relevant research categories under one platform.
A collection of internal and external resources for any skills and tools needed to enact social actions.

A collection of internal and external resources for any skills and tools needed to enact social actions.
Connects individuals to various neighbourhood organizations or post-secondary institutions and their available projects.
Connects individuals to various neighbourhood organizations or post-secondary institutions and their available projects.

To quantify the impact of the website refresh on user engagement, I analyzed three months of pre- and post-launch data from Google Analytics (GA4) and Hotjar.
Continuous web-development refinements were managed through GitHub Issues throughout the brand refresh.
We also kicked off development of new features, including user-login capabilities for the website. Here’s a snapshot of the login functionality progress I contributed to:


